Viewing/Modifying Contents of Variables, Registers, and Memory Areas
When an application is suspended you can inspect variables, registers, memory areas, and you can modify
the value of variables.
Other debug options has been described at Remote debug configurations page.
Variables View
To inspect variables open the Variables View (
 Window > Show View > Other... > Debug > Variables).
BS2IDE performs
Window > Show View > Other... > Debug > Variables).
BS2IDE performs %SDUMP to receive the contents of all variables in the current scope
and displays the variables and their contents in the Variables View.
During stepping or when another breakpoint is reached after Resume
the Variables View is updated and variables with changed contents are highlighted.
The amount of data to be retrieved via %SDUMP can be huge, e.g. if huge arrays are in scope.
In this case the execution of %SDUMP could take a very long time. By default BS2IDE
cancels the execution of %SDUMP after some time, configurable in
Window > Preferences > BS2000 Remote IDE > Remote Debug
as Requested variables tiemout.
If a long time has been configured, a long running %SDUMP can be manually cancelled via the
Progress View (
Window > Show View > Other... > General > Progress).
In the Variables View you can also modify the value of variables. You must enter
new values in the syntax accepted by AID as the modification will be done with %SET commands.
Especially new string values need to be enclosed in '...'.
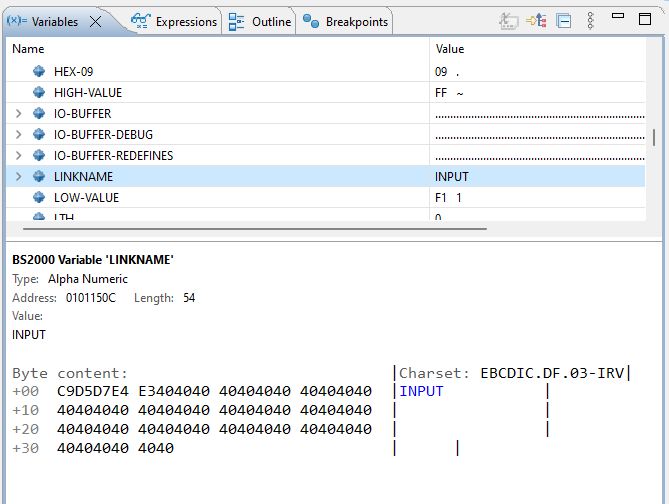
When marking a variable in the Variables View the content of the variable is shown in the
Details Pane. It also contains the address and length of the variable and the dump format of the
variable content if available.
Note: Due to restrictions in AID characters that are not in the range of the BS2000 7-Bit character set are shown as dots in the
Variables View in the list of variables. In the Details Pane the variables are shown in hex-dump format and
there all printable characters are displayed. Printable characters are decoded with provided charset
(NTEXT variables are always decoded with UTF-16). The charset can be changed in connection properties (see Properties of BS2000 Connection ).
Expressions View
Furthermore, a subset of the variables can be watched in the Expressions View (to be opened via
Window > Show View > Other... > Debug > Expressions).
Variables to be watched can either be added manually, or by selecting them in the Variables View and
performing the context menu action Watch.
If the Expressions View is visible and hiding the Variables View, only the
contents of the watched variables is retrieved via AID commands. This is usually faster than requesting
the contents of the entire set of visible variables for displaying them in the Variables View.
As in the Variables View, when variable is selected in the Expressions View, the content of the variable is shown in the
Details Pane with similar restrictions.
Beside watched variables it is also possible to define expressions with arbitrary AID commands
(e.g. %D newaddr->). When reaching a breakpoint BS2IDE tries to verify this AID command.
Value of the watched variables can be changed using contex menu option Set BS2000 Expression Value.
The option opens pop-up where new variable value can be provided. Variable value changes with %SET AID command.
Registers
To inspect the current contents of the S/390 registers open the Registers View (
Window > Show View > Other... > Debug > Registers).
As in the Variables View, registers with changed contents are highlighted.
When marking the PC (program counter) in the Registers View the following statements are diassembled in the
Details Pane.
Memory areas
To inspect the current contents of memory areas open the Memory View (
Window > Show View > Other... > Debug > Memory).
Click the  sign in the
Monitors tab to open a dialog where you can enter the start address of the memory area
you wish to inspect in this monitor. The default representation is hex, but
you can add other renderings by clicking the
sign in the Renderings tab.
sign in the
Monitors tab to open a dialog where you can enter the start address of the memory area
you wish to inspect in this monitor. The default representation is hex, but
you can add other renderings by clicking the
sign in the Renderings tab.
With the (dynamically adjusted) scroll bar in the Memory View you can extend the memory area you wish to inspect.