
%INSERT command for you, using the proper line reference as extracted from the compiler
listing. Line breakpoints are marked with a blue dot in the marker bar. (comment)
You can set breakpoints before starting debugging. Then BS2IDE will enter %INSERT
commands immediately after the configured load command has been executed and before resuming execution
(%RESUME) the first time.
To set breakpoints for not yet loaded modules, e.g. if the application is dynamically bound and some modules are lazily loaded, you can use the Dynamic module load observer option.
Furthermore, breakpoints cannot be set for any line in a source. In most cases it is not known
in advance where breakpoints can be set. AID will reject %INSERT commands for inappropriate lines,
and only at that time you will get informed that this line is inappropriate for setting breakpoints.
If AID accepts %INSERT for one of the 5 following lines, the breakpoint will be
shifted to this line. Otherwise the breakpoint will be disabled.
 Window > Show View > Other... > Debug > Breakpoints)
where you can enable, disable or remove one or all breakpoints. If you mark a breakpoint, the detail pane contain some
information about the breakpoint:
Window > Show View > Other... > Debug > Breakpoints)
where you can enable, disable or remove one or all breakpoints. If you mark a breakpoint, the detail pane contain some
information about the breakpoint:
For Conditional You must insert an aid condition into the
condition field. The program is stopped at this breakpoint if the condition is true. (Sample: COUNTER EQ 354)
For Free form AID sub command You must insert an aid sub command surrounded with angle brackets, which is
executed when the program is stopped at this breakpoint. (Sample: <TEST: (COUNTER EQ 354): %SET 500 INTO COUNTER>)
|
If expression in Expression View cannot be evaluated (debuged program doesn't stop at breakpoint or variable doesn't exist in this context), menu command "Toggle BS2000 Watchpoint" is disabled. |
The BS2000 Watchpoint mechanism is realized using the AID command %ON %WRITE. AID only allows one active
%ON %WRITE command at a time. Thus, if a second BS2000 Watchpoint is defined for the same application,
the currently active one will be disabled and the new one is becoming the active BS2000 Watchpoint for that application.
The BS2000 Watchpoints are displayed in the Breakpoints view together with the common breakpoints. They are
marked with ![]() .
As common breakpoints, defined BS2000 Watchpoints are stored by Eclipse, so that they are available
in future Eclipse sessions. In contrast to a common breakpoint, a BS2000 Watchpoint can only be set
inside the context of its specific stack frame.
.
As common breakpoints, defined BS2000 Watchpoints are stored by Eclipse, so that they are available
in future Eclipse sessions. In contrast to a common breakpoint, a BS2000 Watchpoint can only be set
inside the context of its specific stack frame.
Thus, all BS2000 Watchpoints defined for an application will be disabled automatically when the debug session for that application starts. A BS2000 Watchpoint can then be enabled by the user within the Breakpoints view when the program is suspended and the top-level stack frame is sufficient for that BS2000 Watchpoint.
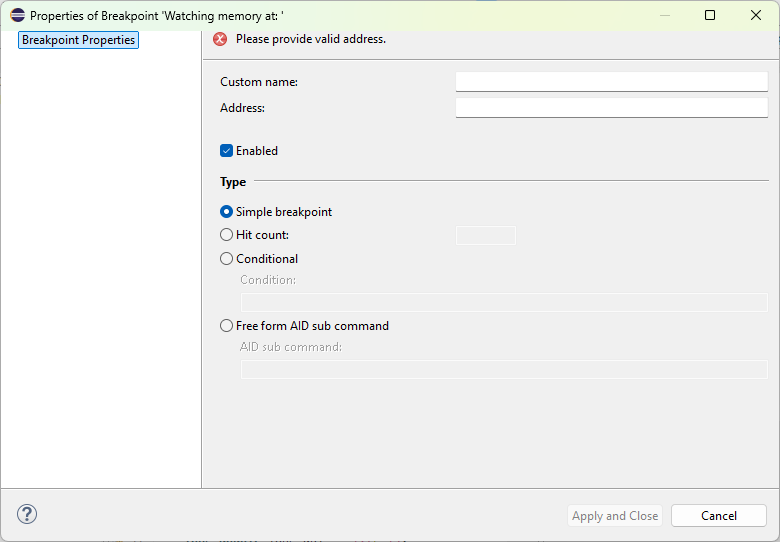
BS2000 Watch Address Breakpoint is a special type of Watchpoint. It interrupts the BS2000 application when memory at given address is modified. It allows to verify changes of the specific memory parts in the program.
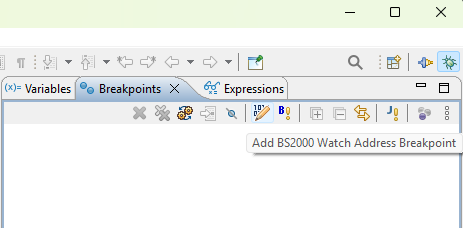
To set the new BS2000 Watch an Address Breakpoint use the toolbar menu action. It will open up the dialog to provide breakpoint properties.
|
BS2000 Watch Address Breakpoint is also the Watchpoint. It means, that only one watchpoint can be active at the same time. After enabling this type of breakpoint, other Watchpoints will be disabled. |
With the BS2000 Event Breakpoint Property Page you can configure an Event Breakpoint. The drop down menu for
Event Type offers all event types that are supported in BS2IDE. For some event types you can specify an
Event Code as offered in the drop down menu. For the event types SVC and ERRFLG
it is also possible to define the event code as numeric value according to the AID syntax. For LPOV you can specify
the name of a load module. Additionally you can configure the Event Breakpoint like common breakpoints (see
Breakpoint Property Page).
The Event Breakpoint mechanism is realized using the AID command %ON <event>. For detailed information
see
|
If an Event Breakpoint (without event code specified) is disabled, all specific Event Breakpoints of the same event type are disabled too. When re-enabling the unspecified Event Breakpoint, they are enabled too. |
%SYMLIB command
in the debug configuration, see Run and Debug Configurations).
The Debug view shows the current call stack. Double-clicking an entry in the call stack also shows the location in a source editor.
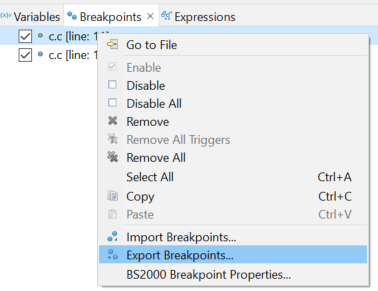
(Alternatively you can select menu File > Export > Run/Debug > Breakpoints)
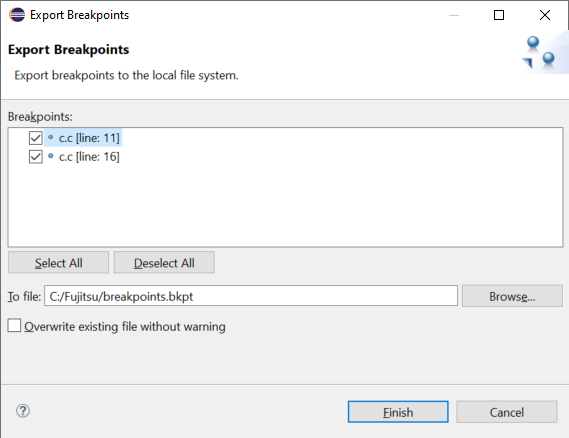
In the next window select which breakpoints should be exported and the target file:
In the next window select exported breakpoints file and optionally you can select to update existing breakpoints (if any):
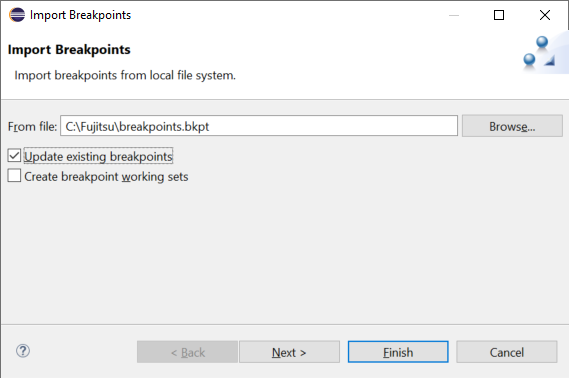
If you click Finish, all breakpoints from this file will be imported.
|
If you click Next, you can select which breakpoints should be imported, but due to the Eclipse issue, all breakpoints from the export file might be duplicated after restarting Eclipse. |